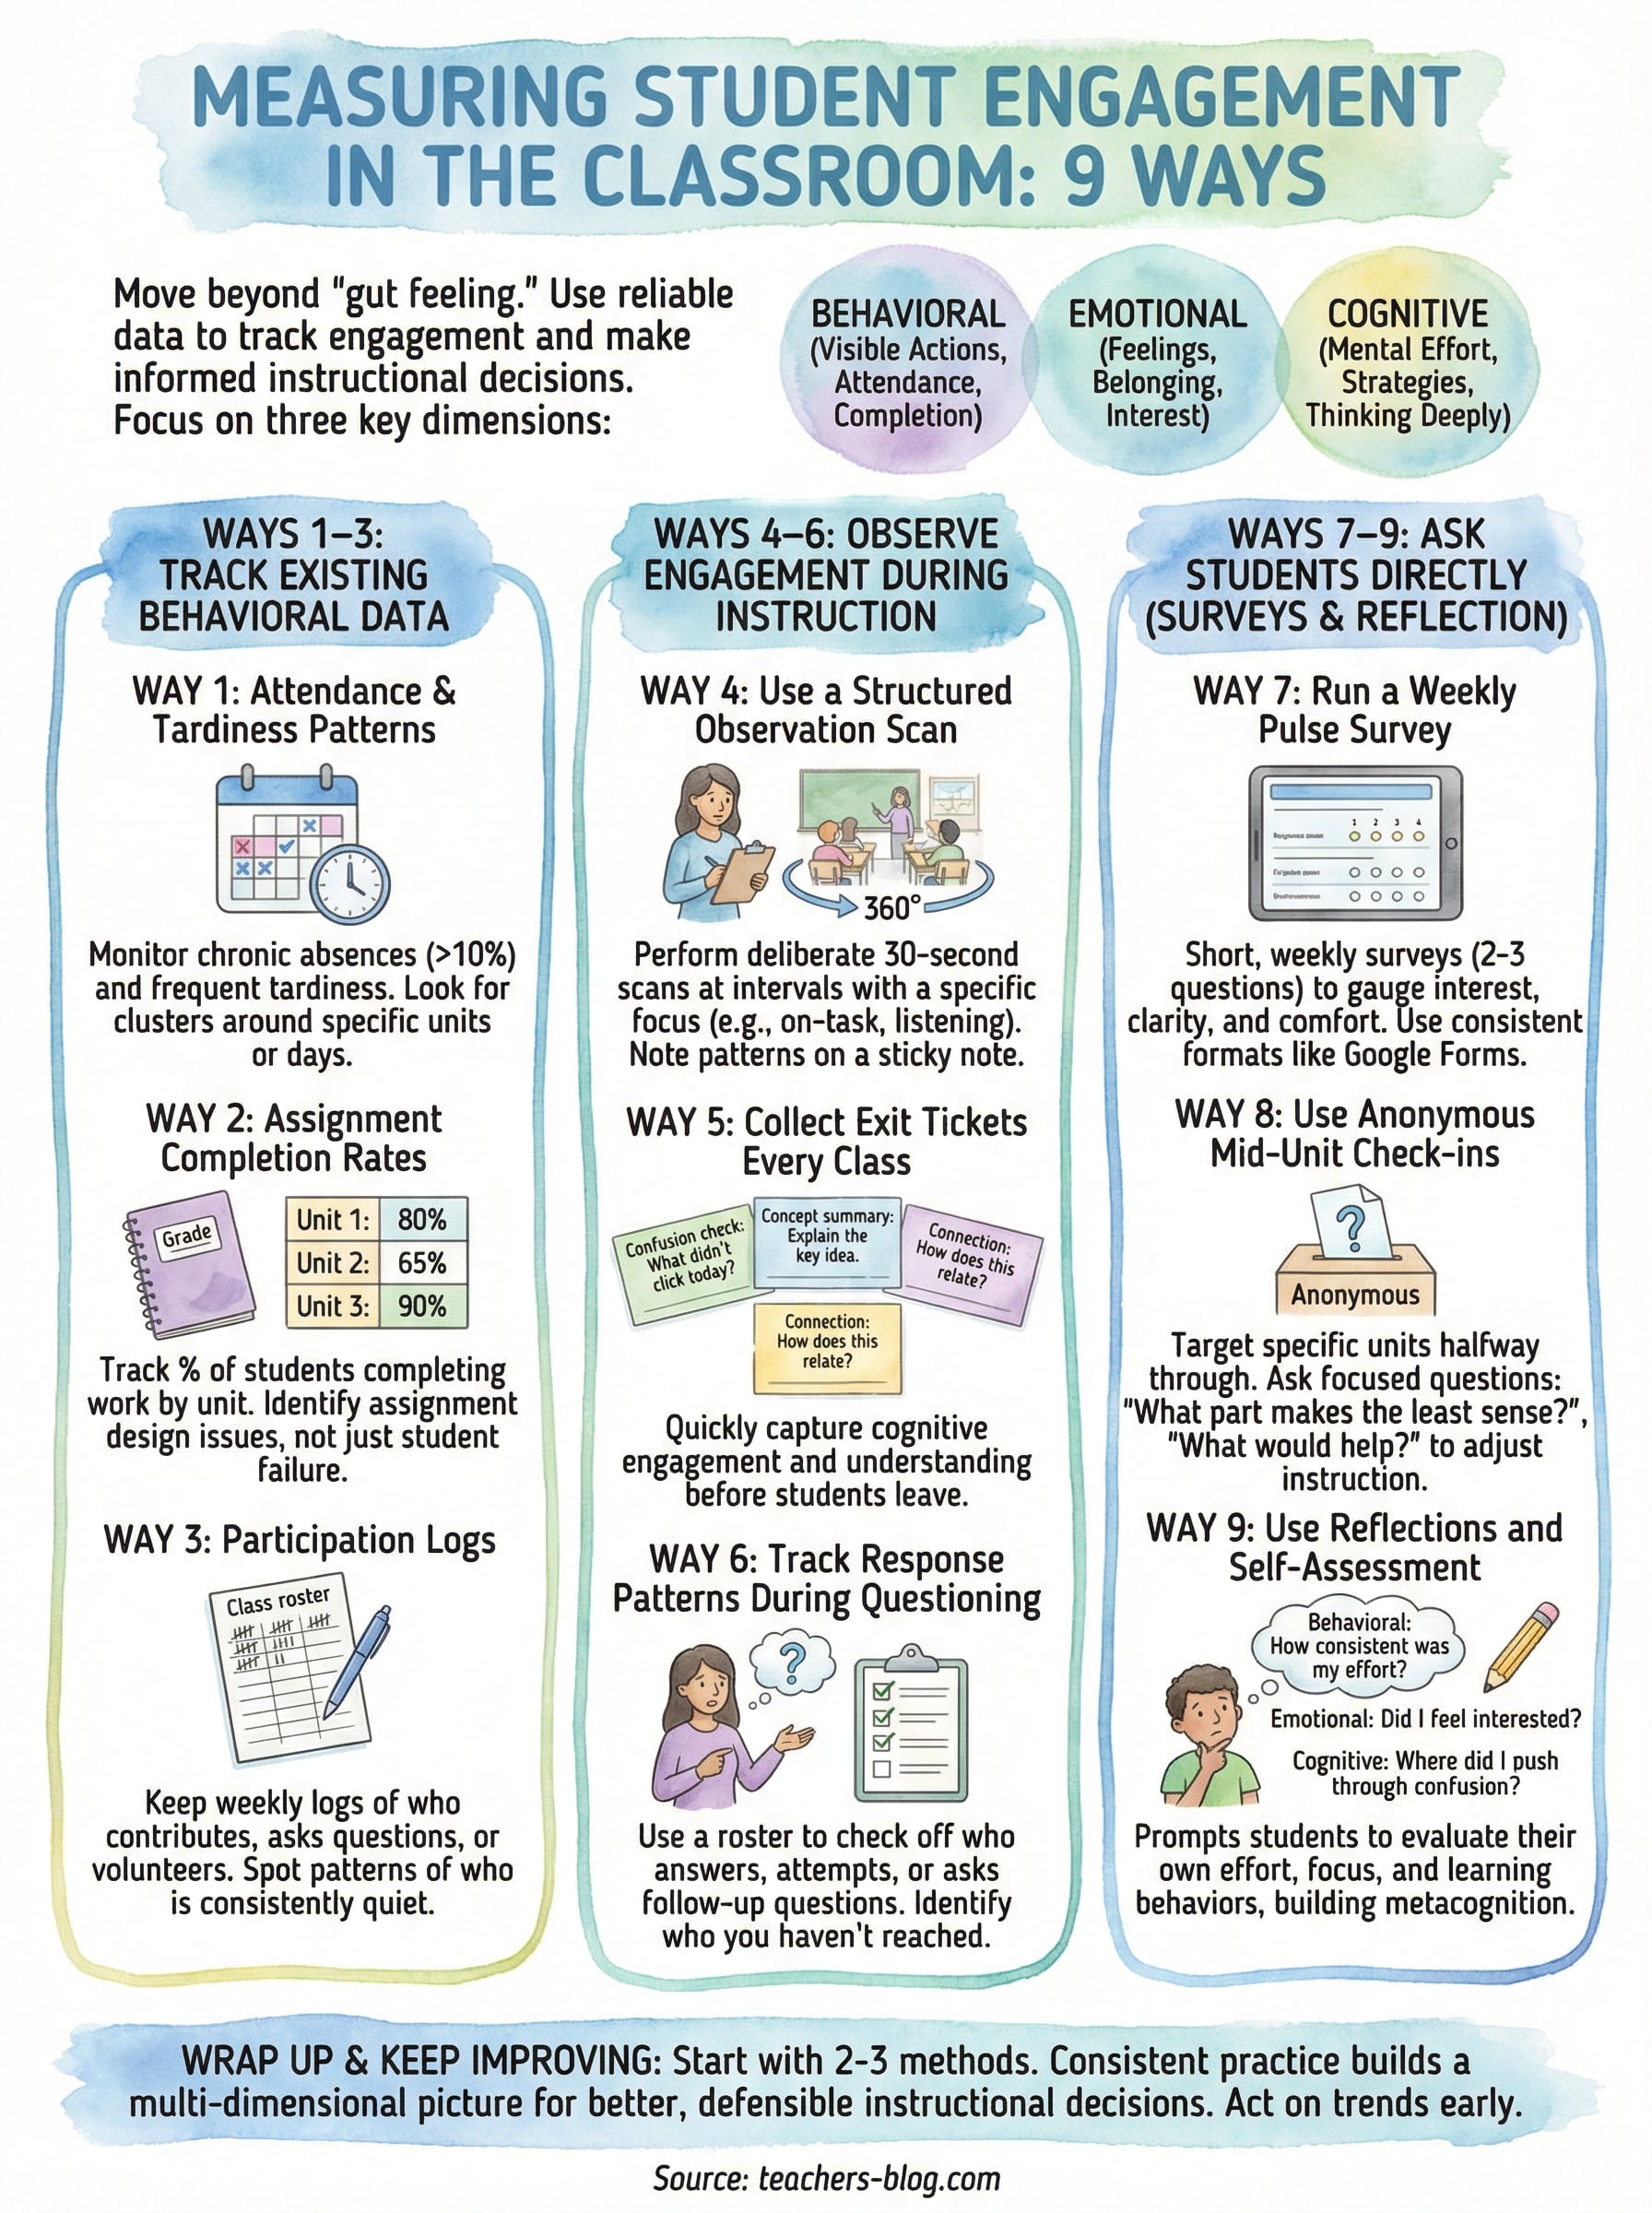
Measuring Student Engagement In The Classroom: 9 Ways
You can feel it when a lesson lands. Students lean in, ask questions, and actually care about the work. But here’s the problem: gut feeling isn’t data. If you want to replicate what works and fix what doesn’t, you need reliable methods for measuring student engagement in the classroom. Without concrete metrics, you’re essentially guessing, and that’s a shaky foundation for instructional decisions that affect every student in the room.
The good news is that tracking engagement doesn’t require a research degree or expensive software. From quick observational strategies to structured surveys and behavioral data, there are practical approaches that fit into a normal teaching day. Some are low-tech. Some use tools like the ones we build here at The Cautiously Optimistic Teacher, where AI-powered resources help educators work smarter without adding hours to their week. The point is: you have options, and most of them are more accessible than you think.
This guide breaks down nine concrete ways to measure student engagement, methods you can start using this week. Each one gives you actionable data instead of assumptions, so you can adjust your teaching with real evidence behind your choices.
What student engagement looks like and why it matters
Student engagement is not a single behavior you can tick off a checklist. It’s a combination of visible actions, emotional investment, and cognitive effort that together tell you whether a student is genuinely connecting with the work. Before you start measuring anything, you need a clear picture of what you’re actually looking for, because if you conflate "quiet compliance" with real engagement, your data will lead you in the wrong direction.
The three dimensions of engagement
Researchers consistently describe engagement across three dimensions: behavioral, emotional, and cognitive. Each one gives you different information, and tracking all three together paints a much more accurate picture than focusing on just one.
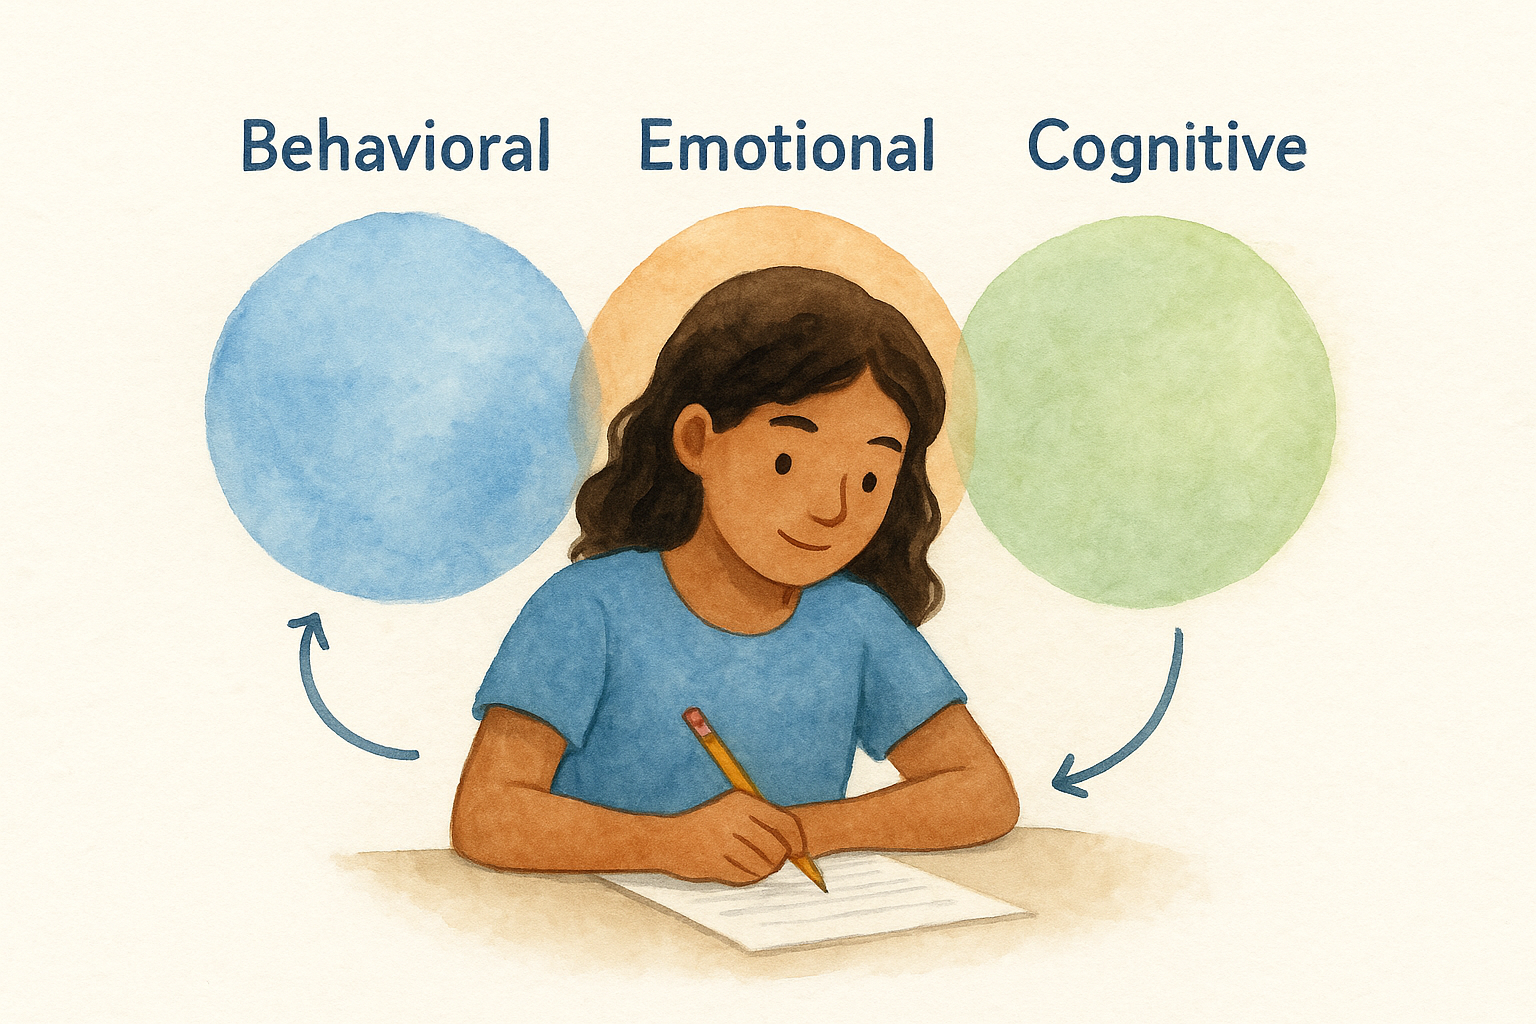
- Behavioral engagement covers what you can see directly: whether students participate in discussions, complete assignments, stay on task, and show up consistently. These are the easiest signals to collect because they’re observable.
- Emotional engagement refers to how students feel about learning. Do they feel like they belong? Are they curious about the material? Do they care whether they succeed? Negative emotions here often show up as avoidance behaviors that you might misread as laziness.
- Cognitive engagement is the hardest to observe. It reflects the mental effort students put in, whether they use strategies, push through confusion, and think deeply about the content rather than just doing the minimum to complete a task.
When you only track one dimension of engagement, you miss students who look fine on the surface but are mentally checked out.
Why measuring engagement changes your teaching
When you’re measuring student engagement in the classroom with actual data rather than impressions, you shift from reactive to proactive. You stop waiting for a student to fail a test before realizing something went wrong. Instead, you catch [early warning signs](https://teachers-blog.com/how-to-increase-student-engagement/): a student who stops participating in group work, exit tickets that show widespread confusion, or survey responses that reveal students feel invisible in your class.
Good engagement data also gives you specific, actionable information you can use to adjust instruction. If you notice that cognitive engagement drops during independent work but spikes during discussion, that tells you something concrete about how your students learn best. That’s far more useful than a general sense that "this class feels off."
Beyond individual lessons, consistent measurement over time helps you identify patterns across units, across students, and across the school year. You start to see which strategies actually move the needle and which ones just feel productive. That kind of evidence base makes your instructional decisions more defensible, not just to administrators, but to yourself. Teaching well requires knowing what’s working, and knowing what’s working requires tracking it.
Ways 1–3: Track behavioral data you already have
Your school already generates a steady stream of behavioral data, and most teachers never use it for engagement analysis. Before you add any new systems to your plate, start by mining what’s already sitting in your gradebook and attendance records. This is the most efficient entry point for measuring student engagement in the classroom because the data costs you nothing extra to collect.
Way 1: Attendance and tardiness patterns
Chronic absenteeism and frequent tardiness are two of the strongest early signals of disengagement. When a student starts missing class regularly or consistently arrives late, something is pulling them away, and it often shows up weeks before academic performance drops. Pull your attendance data at the end of each month and flag any student who has missed more than 10% of class days.
Attendance patterns often tell you more about emotional engagement than any survey will.
Look for these specific warning signs in your records:
- Absences clustered around a particular unit or project type
- Tardiness patterns tied to specific days or class periods
- A student whose attendance rate was fine in September but has declined since November
Way 2: Assignment completion rates
Completion rate is a blunt but reliable behavioral indicator. A student who stops turning in work is communicating something important, even if they say nothing out loud. Track completion percentage by unit across your whole class, not just by individual student. If 60% of students skipped the same task, that’s data about the assignment design, not the students.
| Student | Unit 1 | Unit 2 | Unit 3 | Completion % |
|---|---|---|---|---|
| Example | 5/5 | 4/5 | 3/5 | 80% |
Way 3: Participation logs
Many teachers mentally track who speaks up, but keeping a written participation log turns that impression into usable data. At the end of each week, note which students contributed to discussions, asked questions, or volunteered answers. Over a few weeks, you’ll see clear patterns: who participates consistently, who has gone quiet, and which discussion formats bring less vocal students into the conversation.
Keep it simple: a printed class roster with tally marks works fine. You don’t need a special app to start.
Ways 4–6: Observe engagement during instruction
Behavioral data from your gradebook tells you what happened after the lesson. Observation-based methods let you catch engagement signals in real time, while you still have room to adjust. These three strategies give you structured ways to collect in-the-moment data without stopping the flow of instruction. Each one is a practical tool for measuring student engagement in the classroom as learning actually happens.
Way 4: Use a structured observation scan
Pick two or three specific engagement indicators before your lesson starts, then do a deliberate 30-second scan of the room at set intervals, such as every 10 minutes. Common indicators include: students looking at the task, writing or annotating, and actively listening versus scrolling or off-task talking. Jot a quick tally on a sticky note attached to your clipboard.
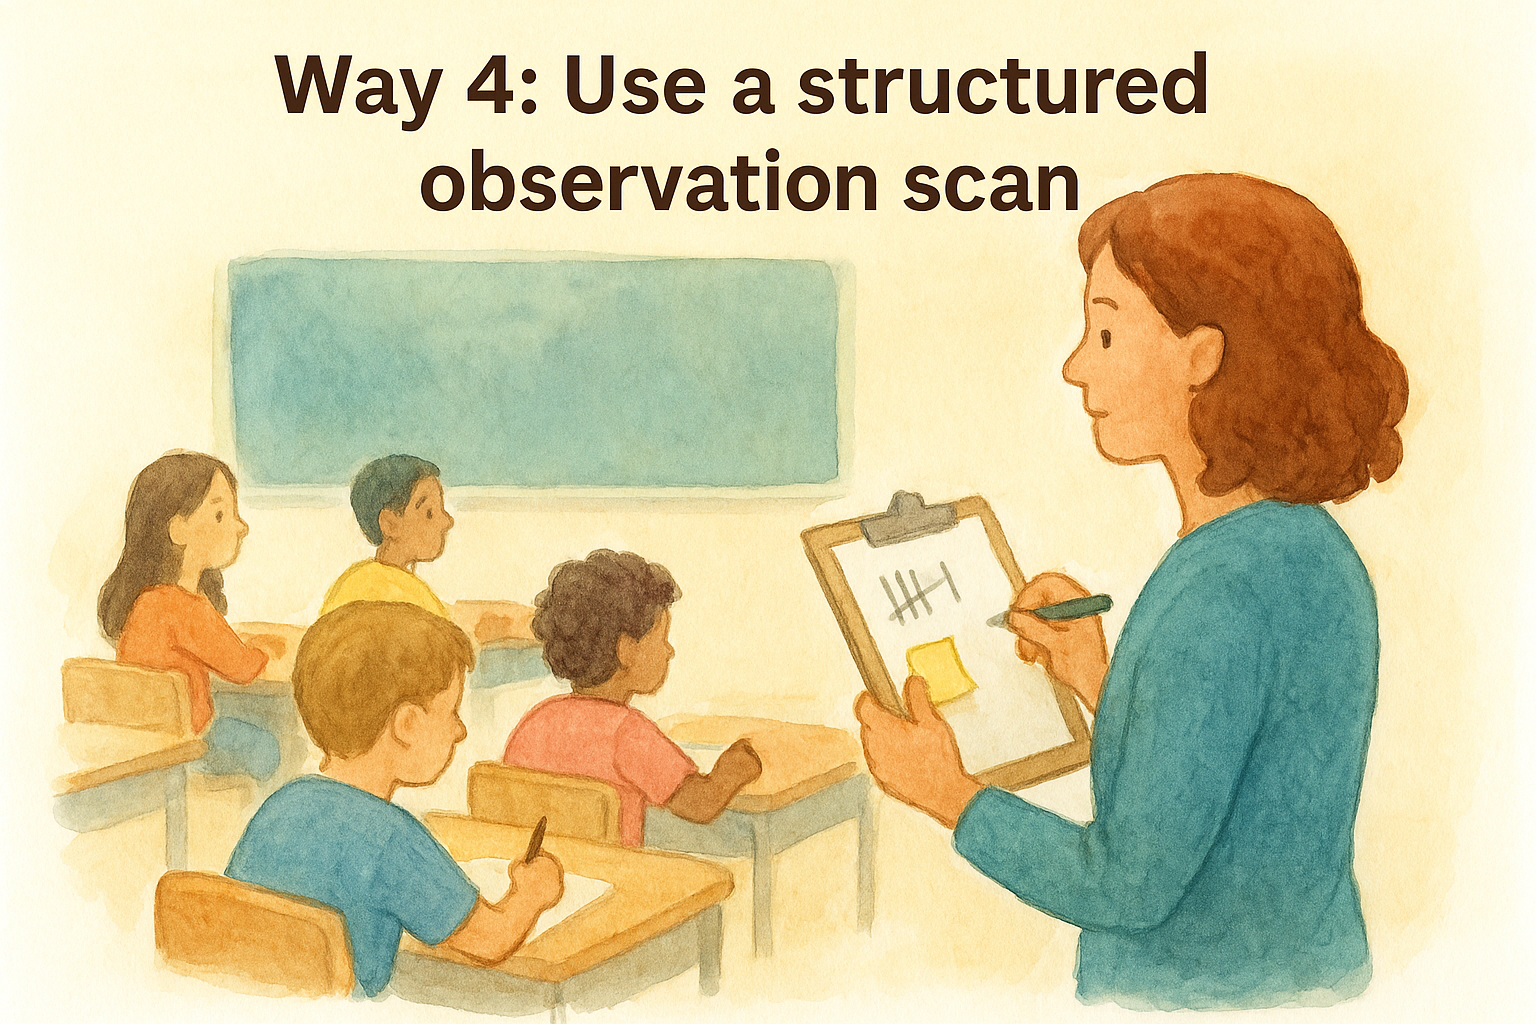
Scanning with a specific focus catches patterns you’d never notice while you’re also delivering content.
After a few lessons, your tally marks will reveal which parts of your lesson consistently lose students, and that’s exactly where you need to look first.
Way 5: Collect exit tickets every class
Exit tickets are one of the most efficient tools available because they capture both cognitive engagement and content understanding in under three minutes. Ask students to respond to one prompt before they leave, something like "What’s one thing you’re still confused about?" or "Explain the main idea in your own words."
Keep a simple exit ticket template you can reuse:
| Prompt Type | Example Question |
|---|---|
| Confusion check | What didn’t click for you today? |
| Concept summary | Explain today’s key idea in 2 sentences. |
| Connection | How does this connect to what we learned last week? |
Way 6: Track response patterns during questioning
Track who responds during whole-class questioning by keeping your class roster nearby and placing a checkmark next to each student who answers, attempts an answer, or asks a follow-up question. Reviewing this after class shows you immediately which students are cognitively present and which ones you haven’t reached in days.
Ways 7–8: Ask students with quick surveys
Observation tells you what you see. Surveys tell you what students actually think. When you’re measuring student engagement in the classroom, self-reported data fills the gap that behavioral observation and gradebook tracking can’t reach: the emotional and cognitive dimensions of engagement that stay invisible unless you ask directly. Two survey approaches work especially well in a normal classroom setting because they’re short, low-stakes, and easy to repeat consistently.
Way 7: Run a weekly pulse survey
A weekly pulse survey takes students under two minutes to complete and gives you structured feedback on how they’re experiencing your class. Keep it to three to five questions and use a consistent format so you can compare results week over week. Google Forms works well for this because responses go directly into a spreadsheet you can scan quickly.
A weekly rhythm matters because engagement shifts with the unit, the season, and what’s happening in students’ lives outside school.
Use this repeatable template to get started:
| Question | Response Format |
|---|---|
| How interested were you in this week’s topic? | 1–5 scale |
| How clear did the lessons feel to you? | 1–5 scale |
| Did you feel comfortable asking for help? | Yes / Sometimes / No |
| What would make next week better for you? | Short written response |
Way 8: Use anonymous mid-unit check-ins
Anonymity changes what students say. When you remove their name from the form, honest responses replace polite ones. A mid-unit check-in differs from the weekly pulse because it targets a specific unit or project rather than general class experience. Run it around the halfway point, when you still have time to adjust before the summative assessment.
Ask two to three focused questions such as "What part of this unit makes the least sense to you?" or "What would help you feel more confident going into the final task?" Read the responses the same day and adjust your next lesson based directly on what students tell you.
Way 9: Use reflections and self-assessment
Surveys tell you how students feel about your class. Reflections go one step further by asking students to evaluate their own effort, focus, and learning behaviors directly. This is one of the most underused methods for measuring student engagement in the classroom because it builds metacognitive awareness in students at the same time it gives you data. When students regularly stop and think about how engaged they actually were, they start to notice their own patterns, and that self-awareness often drives engagement up on its own.
Give students a structured reflection prompt
Unstructured reflection produces vague answers. Give students specific questions that target the three dimensions of engagement: behavioral, emotional, and cognitive. A short written prompt at the end of a unit or major project works better than asking broadly "how did it go?" because it forces students to think concretely about what they actually did.
Structured prompts turn reflection from a throwaway activity into a genuine source of engagement data.
Use this repeatable reflection template at the end of each unit:
| Prompt | Focus Area |
|---|---|
| How consistently did you complete the work this unit? | Behavioral |
| Did you feel genuinely interested in this topic? Why or why not? | Emotional |
| Where did you push through confusion instead of giving up? | Cognitive |
| What would you do differently if you did this unit again? | All three |
Turn self-assessment into a pattern you track
One reflection gives you a snapshot. Repeated reflections across multiple units give you a trend line, and that’s where the real value lives. After students complete the template, collect their responses and look for shifts. A student who rates their cognitive effort consistently low is telling you something specific about their level of challenge or interest in the material.
Keep a simple folder, physical or digital, for each class period. Review the responses alongside your participation logs and exit ticket data to build a complete picture of where engagement stands for each student.
Wrap up and keep improving
Measuring student engagement in the classroom gets easier the more consistently you practice it. You don’t need to run all nine methods at once. Start with two or three that fit naturally into your current routine, such as attendance tracking, exit tickets, and a weekly pulse survey. Once those feel automatic, layer in observation scans and unit reflections. Over time, you build a multi-dimensional picture of engagement that makes your instructional decisions sharper, more targeted, and easier to defend when students or administrators ask why you’re teaching the way you are.
The goal isn’t perfect data. The goal is better information than you had before, gathered regularly enough to spot disengagement trends early and act before they compound. Every method in this guide gives you something concrete to work with starting this week. If you want more practical tools and strategies to support your classroom work, visit The Cautiously Optimistic Teacher for resources built specifically for educators who want to teach smarter and more efficiently.