How to Create and Use an Inferencing Anchor Chart that Supercharges Comprehension
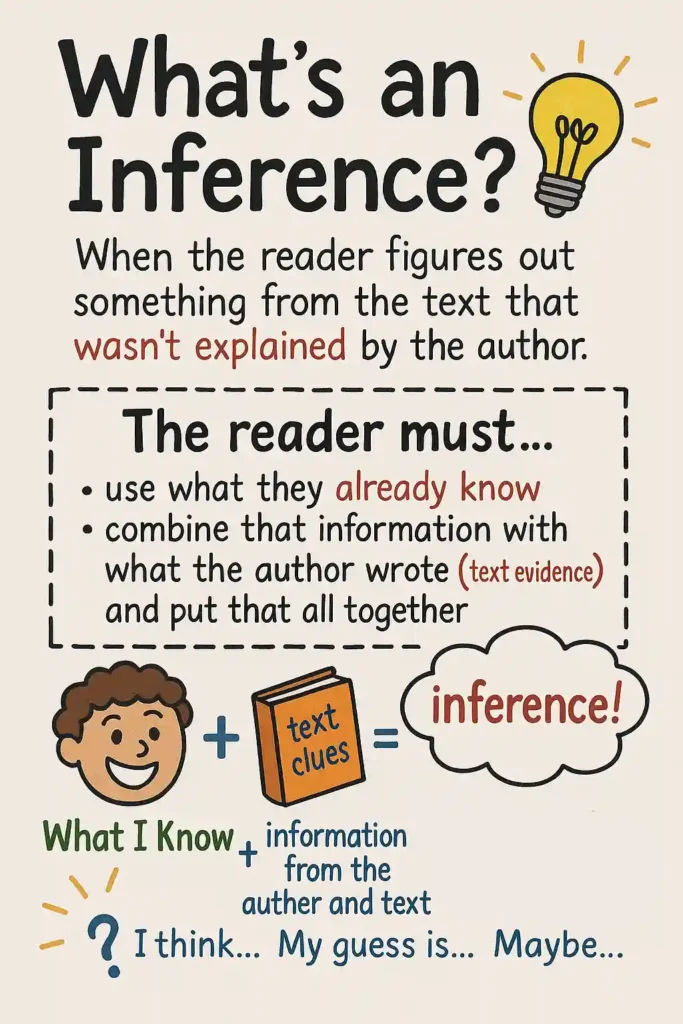
Every time students read between the lines—guessing why a character slammed a door or predicting what might happen next—they’re practicing inferencing. Yet many readers don’t realize how often they use background knowledge and textual evidence to arrive at those unspoken conclusions. An inferencing anchor chart turns that hidden thinking into something they can see. By making the mental process explicit and visible, we give learners a dependable roadmap they can refer to long after the mini-lesson ends.
In this post–lesson plan hybrid, you’ll learn why an inferencing anchor chart deserves wall space in every literacy classroom, how to design it from scratch, and exactly how to weave it into a full lesson that hits curriculum standards without draining prep time.
Why an Inferencing Anchor Chart Matters
1. It Bridges Concrete and Abstract
Students often believe that “good readers just know.” An anchor chart demystifies that myth by breaking inference into clear steps—observe clues, connect background knowledge, draw a conclusion—so even reluctant readers see a replicable strategy.
2. It Supports Dual Coding Theory
Research shows that pairing text with relevant visuals improves recall and comprehension. The inferencing anchor chart fuses symbolic icons (footprints for clues, a lightbulb for brain connections, etc.) with concise wording, tapping both visual and verbal memory pathways.
3. It Promotes Metacognition
When learners refer to the chart mid-reading, they effectively pause to check their own thinking: Did I gather all the clues? Have I connected them to what I already know? That self-monitoring boosts higher-order reasoning across subjects.
4. It Provides Scaffolded Independence
Because the anchor chart stays posted, students can rely on it during independent reading or small-group work instead of asking the teacher to re-explain the process—freeing you to confer or differentiate.
A vow of silence. A mission across centuries.
Adam never chose to be silent; the Phylax demanded it. Trained from childhood as a time-traveling enforcer, he slips through centuries to eliminate those who threaten the future. His latest mission: assassinate Emperor Qin Shi Huang before a ruthless plot ultimately destroys humankind.

Design Blueprint: Building Your Inferencing Anchor Chart
Time Needed: 25–30 minutes
Materials: 24 × 36 chart paper, colorful markers, sticky notes, sample short text or image prompt, and optional clip-art icons for students who benefit from extra visual cues.
Step 1: Pick a Short Mentor Text or Image
Choose a paragraph or wordless picture brimming with unstated emotions or causes. You’ll reference it as you build the chart; real examples keep the visuals authentic.
Step 2: Sketch the Three-Box Layout
Draw three large rectangles across the chart paper labeled
Clues from the Text
What I Know
Inference
Leave generous white space beneath each heading. Bold colors help each section stand out even from the back row.
Step 3: Add Iconic Visuals
Next to each heading, draw or paste a simple symbol—magnifying glass, thought bubble, and conclusion arrow—so emerging readers or multilingual learners grasp meaning quickly.
Step 4: Model the Thinking Aloud
Using your chosen mentor text, write an example clue in box 1 (“door slams”). In box 2 jot prior knowledge (“people slam doors when angry”). Then connect arrows to box 3 where you pen the inference (“the character is upset”). Say each step aloud—this provides a live demonstration of how textual evidence + schema = inference.
Step 5: Invite Student Contributions
Hand out sticky notes and let learners add their own clues, background links, or inferences. They’ll see the chart evolve from teacher-centered to community-generated, increasing ownership.
Step 6: Color-Code the Connections
Use the same marker color for each trio of notes that belong together. Color coding reinforces the idea that an inference is incomplete without both evidence and knowledge.
Step 7: Title and Post Strategically
Label the top in large lettering: “Inferencing Anchor Chart: Clues + Knowledge = Smart Guess” and hang it at eye-level where guided-reading groups can reference it easily.
Full Lesson Plan: Teaching Inference with Your New Anchor Chart
Learning Objective (Grade 5–8 adaptable)
Students will use textual clues and prior knowledge to infer character emotions and motivations, citing evidence for each inference.
Materials
Completed inferencing anchor chart
Class set of sticky notes or mini whiteboards
Short story excerpt or high-interest article
Exit tickets
Lesson Steps
Hook (5 min)
Display a wordless comic panel showing a character reacting to spilled coffee. Ask, “What’s happening here?” Without revealing the answer, jot a few guesses to prime inferencing skills.Explicit Teach & Anchor Chart Walkthrough (10 min)
Point to each box on your inferencing anchor chart. Think aloud using the comic panel: clue (coffee spill), background knowledge (people hate stains), inference (character feels annoyed). Highlight how the visual reminds us of the three-step cycle.Guided Practice (10 min)
Hand out the text excerpt. Read it aloud once, then chunk it paragraph by paragraph. After each chunk, pause and invite students to record clues on sticky notes and place them in box 1. Together, fill in known facts in box 2, then infer in box 3.Collaborative Small-Group Work (15 min)
Groups receive fresh paragraphs. Using the anchor-chart process, they compile clues and background knowledge, writing a shared inference on a poster. Encourage them to color-code like the chart. Circulate to prompt deeper connections.Share-Out & Reflect (10 min)
Groups present their inference posters. As they share, point back to the anchor chart, reinforcing the steps. Ask, “Which part felt easiest? Which part challenged you?”Independent Application (Homework or Workshop) (optional)
Assign independent reading pages. Students must list at least two clues and one inference to discuss in the next session, referencing the anchor chart if they get stuck.Assessment & Exit Ticket (5 min)
Provide a two-sentence mini-passage with ambiguous emotion. Students write an inference and underline the textual clue. Collect these to gauge understanding.
Differentiation Tips
ELL Scaffolds: Add picture icons for common emotions beside box 3.
Advanced Readers: Challenge them to locate multiple clues leading to a single inference, emphasizing layered evidence.
Struggling Readers: Offer sentence stems (“I infer ___ because the text says ___ and I know ___”).
Extending the Anchor Chart Across the Curriculum
Science: Infer reasons for an experimental outcome from data trends.
History: Infer motives of historical figures by examining primary-source quotes and contextual knowledge.
Math: Infer a pattern rule from a sequence of numbers.
Maintenance: Keeping the Anchor Chart Alive
An anchor chart dies a slow death when it fades into background wallpaper. Revive it by:
Adding fresh sticky notes each time students encounter a tricky inference.
Photographing and uploading the chart to your digital classroom for homework reference.
Rotating student examples weekly, so learners see their thinking proudly displayed.
Final Thoughts
Creating an inferencing anchor chart isn’t just a craft activity—it’s an instructional powerhouse. By externalizing an abstract cognitive skill, you give students a concrete tool for tackling texts across genres and subjects. Post one in your room this week, and watch as those once-hidden “aha!” moments become classroom conversations you can actually see.